SMU4000 graphing
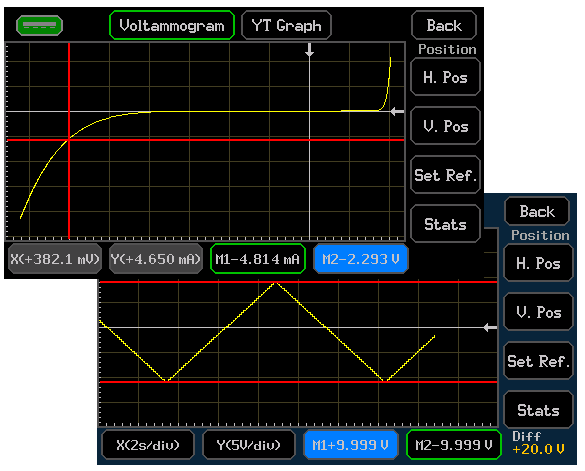
The SMU4000 Series provides graphical display of the measured results on screen without requiring external software.
This may be real time data or data already in the buffer. Traces may be saved and recalled. Graphs may
be Auto-Scaled (the graticule is auto-ranged to fit the data with the most appropriate number of
units per division) or Auto-Fit (the graph is scaled to show all the data at once without maintaining
a defined range of units per division) or it may be manually scaled.
Two main types of graph are provided:
Two main types of graph are provided:
- VOLTAMMOGRAM - plot showing volts against amps
- YT - plot the selected measurement on the Y axis against time (T)